
Residual Gas Analysis with Quadrupole Mass Spectrometry
Residual gas analysis is a real-time technique for examining the molecular components present in a vacuum vessel or evolved from a system. By identifying gases and contaminants as they appear, residual gas analysers help users characterise their vacuum systems, diagnose process issues and optimise operating conditions.
RGA is particularly valuable because it provides online analysis in real time. This allows users to monitor base pressure fingerprints, detect leaks, identify virtual leaks or desorption effects, observe outgassing during bakeout cycles, evaluate pump performance and investigate chamber contaminants.
What is residual gas analysis?
Residual gas analysis is the examination of molecular species within a vessel or released from a system. In vacuum applications, this gives users a direct view of the gases present and how they change during operation.
This information can be used to support fault diagnosis, process control, system conditioning and contamination investigation. Rather than only measuring total pressure, RGA provides a mass spectrum that helps identify which gases are contributing to the vacuum environment.
What can residual gas analysis identify?
Typical contaminant species can be recognised using characteristic mass-to-charge peaks. In RGA, mass-to-charge ratio is commonly expressed as m/e or m/z.
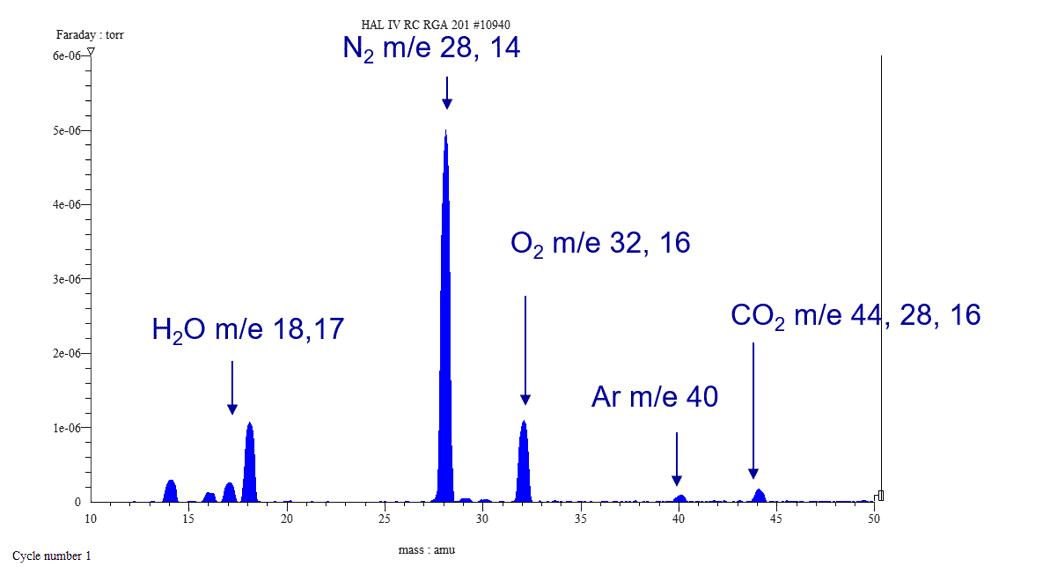
An air leak is typically indicated by peaks at m/e 28 and m/e 32 in a ratio of approximately 4.5:1. The presence of peaks at m/e 14 and m/e 16 can help confirm the interpretation.
Water vapour is typically identified by m/e 18 and confirmed by m/e 17. Hydrocarbons produce characteristic groups of peaks, with typical examples at m/e 57, 55, 45 and 43.
High-mass peaks may indicate back-streaming oil or vacuum grease. Low-mass peaks may indicate cleaning fluid or solvent residues.

How quadrupole residual gas analysis works
A quadrupole residual gas analyser typically relies on three main stages: ionisation, mass filtering and detection. Gas molecules are first converted into ions, then separated according to their mass-to-charge ratio and finally detected as an electrical signal.
Electron impact ionisation
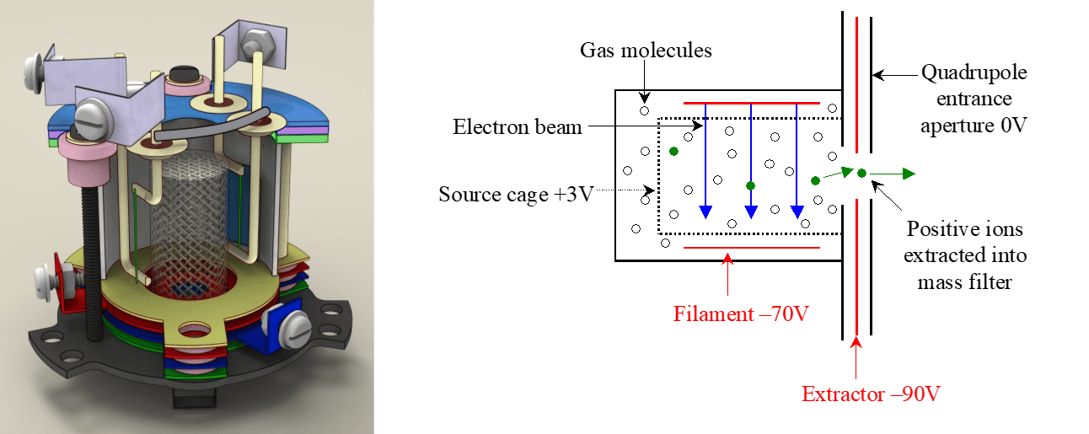
Operation begins with the conversion of gas molecules into charged particles, typically positive ions or fragments. This is achieved by electron impact ionisation through thermionic emission from a hot filament. A typical current is 1 x 10^-4 A.
Once ions are formed, they are extracted into the mass filter.
Ionisation depends on the nature of the species involved. If a species is readily ionised, it produces a higher mass spectrometer signal than one that is poorly ionised. Nitrogen is used as the standard with a relative sensitivity of 1. Benzene is 5.9 and helium is 0.14.
This means that peak height does not depend only on concentration. It is also influenced by how efficiently a species is ionised and detected. For quantitative gas analysis, relative sensitivity must therefore be considered.
Filament material and outgassing
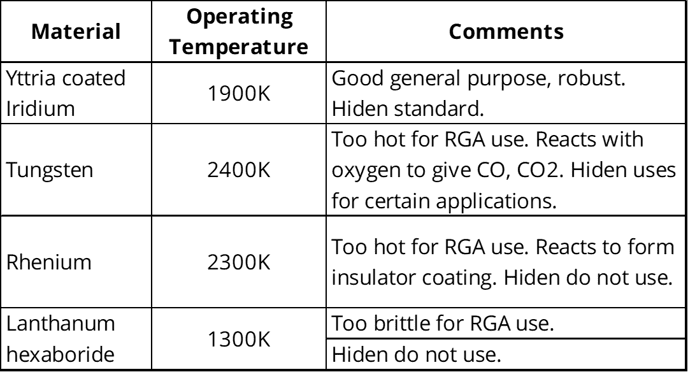
The choice of filament material is important because lower operating temperature can reduce outgassing. Reduced outgassing is valuable in residual gas analysis because it helps minimise unwanted background contributions from the analyser itself.
Yttria-coated iridium is Hiden’s standard filament material, operating at approximately 1900 K and is a robust general-purpose choice.
Ion types produced by electron impact ionisation
Electron impact ionisation can produce several ion types. These include molecular ions, base ions, fragment ions, rearrangement ions, doubly charged ions and metastable ions.
Fragment ions are also known as product ions or daughter ions. These are especially important because their presence creates cracking patterns that can be used to help identify species in a mass spectrum.

The quadrupole mass filter
After ionisation, ions enter the mass filter. The most common form of mass filter used in residual gas analysis is the quadrupole.
Ionisation:
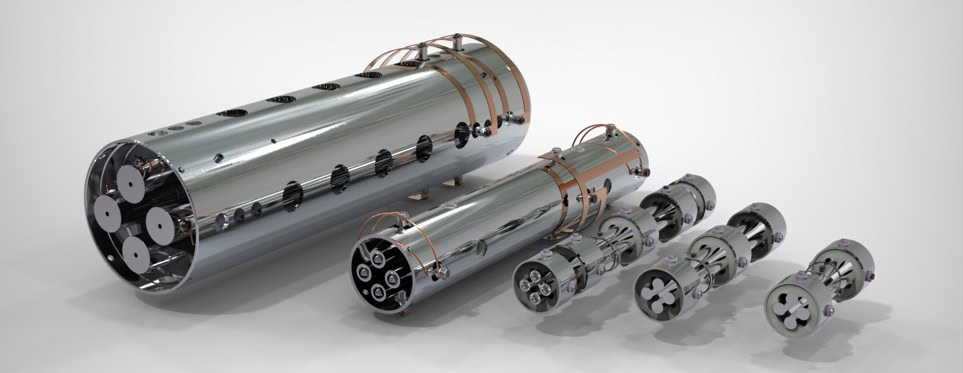
A quadrupole consists of two pairs of parallel, equidistant metal rods biased at equal but opposite potentials. These twin potentials contain fixed DC and alternating RF components. By varying the RF component, the field produced by the rods can be varied.
The mass filter:
Any ions entering the quadrupole field experience potential differences that deflect them from their original trajectory. The extent of deflection is related to the ion’s mass-to-charge ratio. At each interval in the RF scan, only one m/e ratio resonates with the field and passes along the z-axis. Other species are deflected and neutralised by impact with the quadrupole rods.
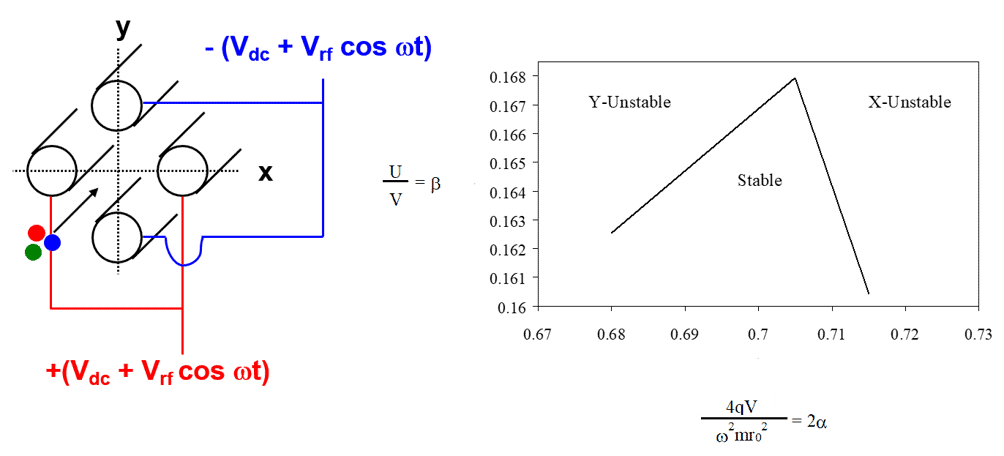
Mathieu stability diagram
The detector: options in residual gas analysis
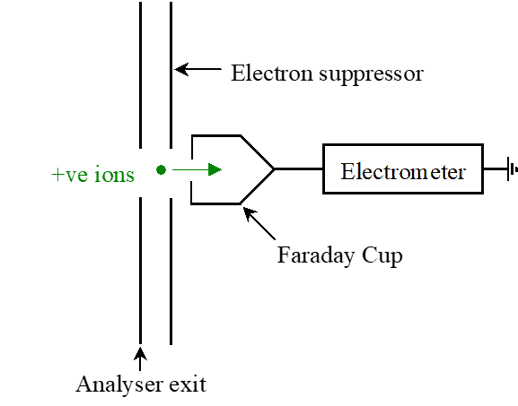
Filtered ions strike the detector and produce an ion current, which is measured by a sensitive amplifier. There are two main detector types: the Faraday cup and the secondary electron multiplier, also referred to as SEM or SCEM.
Faraday cup detector
A Faraday cup is an earthed passive conducting surface with a suppressor electrode to avoid false measurement. Fast-moving ions strike the cup and cause a shower of secondary electrons. The cup design allows these electrons to be collected, giving amplification because one arriving ion can cause several electrons to be emitted.
Detection limits eg, Nitrogen, the ion current is 10^-4 A/mbar. At 10^-8 mbar of nitrogen, the resulting current is calculated as 10^-12 A. At 10^-11 mbar of nitrogen, the resulting current is 10^-15 A, which is presented as the detection limit for a conventional analogue amplifier.
The Faraday cup is lower cost, indestructible and accurate. Its limitations are a detection limit of approximately 10^-11 mbar and relatively slow measurement near the detection limit.
Secondary electron multiplier and single channel electron multiplier
A secondary electron multiplier is a surface designed to generate secondary electrons. When an ion impacts the surface, it generates two or three electrons. Each of these electrons undergoes further surface collisions, generating more electrons in a cascade effect. This cascade is powered by an applied voltage
Gain is typically 10^3 for an SEM, with 10^2 for a channel plate. The minimum detectable pressure is 10^-14 mbar to 10^-13 mbar.
SEM and SCEM detectors offer lower detection limits and faster measurement. However, they are more expensive, expendable and species dependent. Their sensitivity can also depend on time and application. Typical maximum pressure range is 10^-5 to 10^-6 mbar.
Resolution in residual gas analysis
Resolution describes the ability to separate ions of different m/e ratios. Definitions of resolution directly or indirectly relate peak width to peak height. Eg, M / DM
For any given mass M, the peak width at 10% of the peak height, measured from the baseline, should be less than 1 amu.
Resolution can become more complicated when trace species occur in the peak tail of a major species. For example, detecting m/e 27 or m/e 29 may be complicated by the presence of nitrogen at m/e 28.
Interpreting RGA spectra and cracking patterns
RGA data can be presented as a profile of mass-to-charge peaks. Interpreting the spectrum requires understanding molecular ions, fragment ions, cracking patterns, isotope patterns, relative sensitivity and overlapping species.
The RGA of Air:
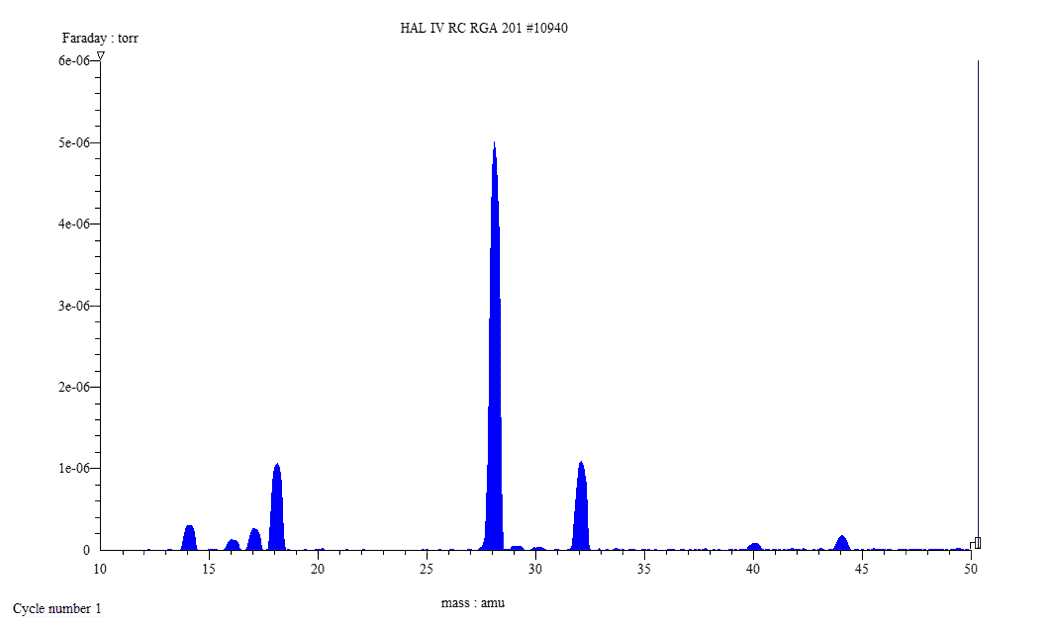
A general approach to interpreting a mass spectrum is to look first for molecular ions, then examine the overall appearance of the spectrum. Users should check for isotope peak clusters, low-mass neutral fragment losses such as CH2, and characteristic low-mass fragments. Comparison with reference spectra can then support identification.
Cracking patterns and fragmentation
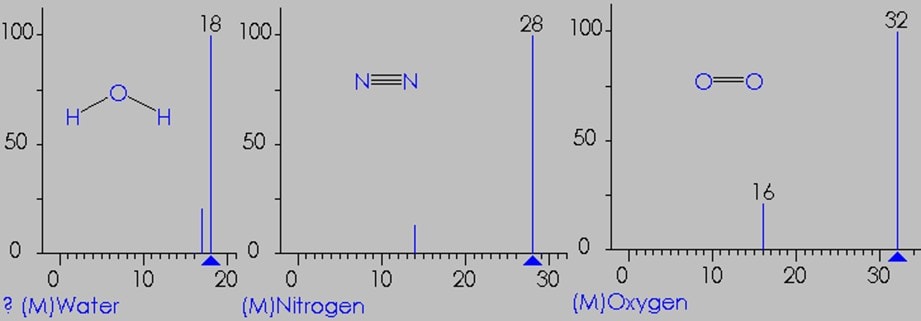
Cracking occurs during ionisation when high-energy electrons not only ionise species but also fragment them. For carbon monoxide, ionisation produces a molecular ion peak at m/e 28. Fragmentation can also produce peaks at m/e 16 and m/e 12.
This fragmentation can be used to differentiate isobaric species, such as 12C16O and 14N2. Both have the same nominal mass at m/e 28, but their fragmentation patterns differ.
Nitrogen has peaks at m/e 28 from N2+ and m/e 14 from N+ and related ionisation behaviour. Comparing these patterns helps distinguish carbon monoxide from nitrogen when both may contribute to the same nominal mass.
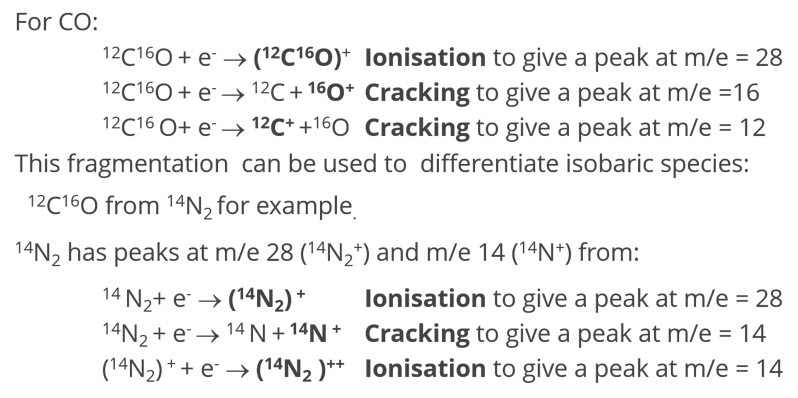
Under normal conditions, the cracking pattern is characteristic of a species because it is directly related to the energy of the electrons used.
Examples include:
- Nitrogen: m/e 28 and 14
- Water: m/e 18 and 17
- Oxygen: m/e 32 and 16
- Argon: m/e 40
- Carbon dioxide: m/e 44, 28 and 16
Cracking patterns in linear hydrocarbons
Linear hydrocarbons can show similar cracking patterns because they fragment into related alkyl-type species. We can compare decane, C10H22, and butane, C4H10.
Both compounds show peak clusters at m/z 57, 43 and 29, with loss of a unit of mass 14. This corresponds to the loss of alkyl-type CH2 units.
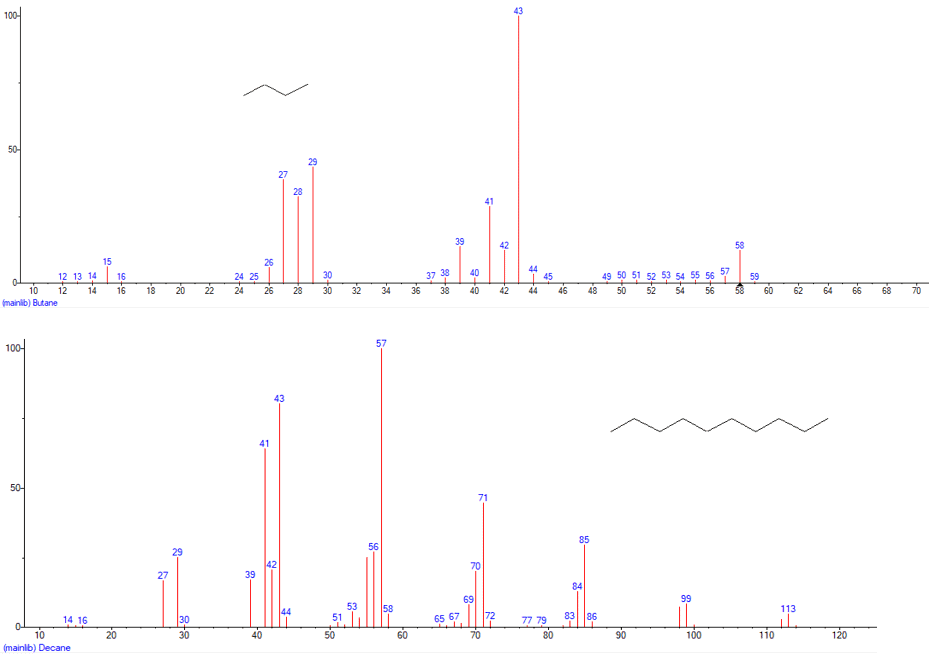
Fragmentation involves both bond cleavage and ionisation. Example: decane and butane can form fragments such as CH3+, C2H5+, C3H7+ and larger alkyl fragments, depending on the parent molecule.
Isotopic abundance in mass spectra
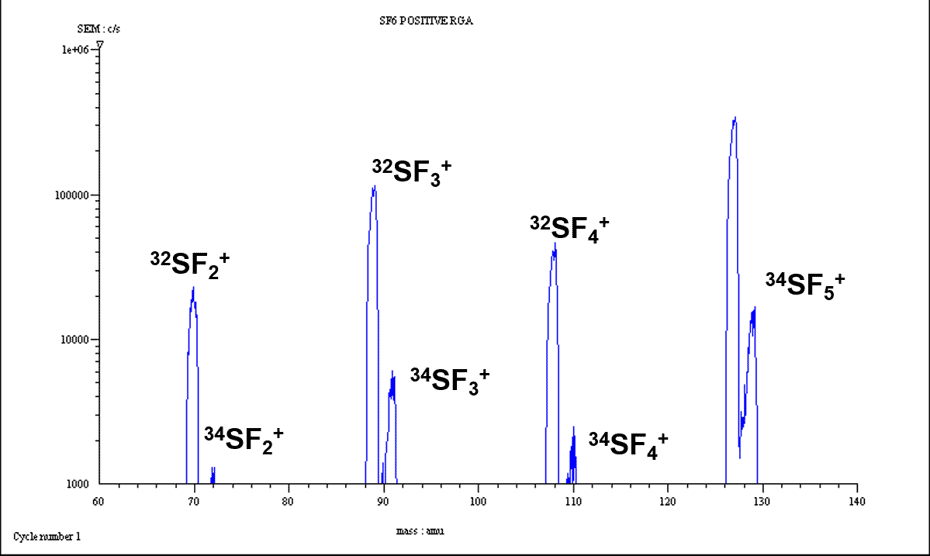
Many species exist as several naturally occurring isotopes. These isotope patterns can create characteristic peak clusters that help identify species in mass spectra.

Example:sulphur hexafluoride, sulphur isotope patterns can produce peaks associated with fragments such as 32SF5+, 34SF5+, 32SF4+, 34SF4+, 32SF3+, 34SF3+, 32SF2+ and 34SF2+.
Practical interpretation workflow
A structured approach makes RGA interpretation more reliable.
General steps in interpretation of a mass spectrum:
- Look for the molecular ion or ions.
- Note the general appearance of the spectrum.
- Check the spectrum for isotope peak clusters.
- Check for low-mass neutral fragment loss, such as CH2.
- Check for characteristic low-mass fragments.
- Compare the results with reference spectra.
This workflow helps reduce the risk of misidentifying overlapping peaks or assigning a species based only on a single mass.
Hiden quadrupole mass spectrometers
Hiden manufactures a wide range of mass spectrometry systems tailored to specific customer applications, with mass range options of 50, 100, 200, 300, 510, 1000 and 2500 amu.
Ioniser options include cross-beam, gold-plated and platinum designs. Detector options include Faraday detectors, electron multipliers, channelplate and Channeltron detectors, with analogue current measurement and digital pulse ion counting options.
There are options for 6 mm, 9 mm and 20 mm pole diameter options, single and triple filter options, and Ethernet, USB and serial communications.
Learn more about our range of systems.
Hiden gas analyser features
Hiden gas analysers are rugged, modular systems with precision-machined radial ceramic rod supports. Features include: a powerful processor with data buffering for true multi-tasking operation, ion-blast-free operation for maximum sensitivity in helium leak detection, and detection to 5 x 10^-14 Torr or ppb levels.
Other features include bench, cart or console mounting, fully automated operation, application-specific gas inlets, corrosive gas and oil-free pumping, multi-stream options and quantitative gas analysis.
Common residual gas contaminants
The table shows the common RGA contaminants. These tables should be used as a practical reference for readers interpreting residual gas spectra.


Applications of residual gas analysis
Residual gas analysis can support a wide range of vacuum and process applications, including base pressure fingerprinting, leak detection, virtual leak investigation, desorption studies, outgassing analysis, bakeout cycle monitoring, pump performance evaluation and chamber contaminant identification.
It can also support the detection of hydrocarbons, cleaning fluid residues, solvent residues, back-streaming oil and vacuum grease. In configured systems helium leak detection, multi-stream options and quantitative gas analysis.
Benefits of quadrupole RGA
Quadrupole residual gas analysis provides real-time insight into what is present in a vacuum system. This allows users to move beyond total pressure measurement and identify the specific gases contributing to the process environment.
Key benefits include faster diagnosis of leaks and contamination, improved understanding of outgassing behaviour, better process characterisation, support for pump performance checks and improved confidence in system cleanliness.
Conclusion
Residual gas analysis with quadrupole mass spectrometry is a practical technique for identifying and monitoring gases in vacuum systems. By combining electron impact ionisation, quadrupole mass filtering and sensitive ion detection, RGA systems can detect air leaks, water vapour, hydrocarbons, outgassing, pump-related contamination and other residual gas species.
Accurate interpretation depends on understanding molecular ions, fragment ions, cracking patterns, isotope abundance, detector behaviour, resolution and relative sensitivity. With appropriate configuration, quadrupole RGA systems can support vacuum diagnostics, process optimisation and contamination control.
Contact Us
To discuss residual gas analysis for your vacuum system, process or application, contact us for technical support and guidance on the most suitable quadrupole mass spectrometer configuration.
FAQ section
What is residual gas analysis?
Residual gas analysis is the real-time examination of molecular species present in a vacuum vessel or evolved from a system. It helps identify gases, leaks, contamination, outgassing and process-related changes.
How does a quadrupole RGA work?
A quadrupole RGA ionises gas molecules, separates the resulting ions according to mass-to-charge ratio and detects the selected ions as an electrical signal. The output is a mass spectrum showing the gases present.
What can RGA detect in a vacuum system?
RGA can help detect air leaks, water vapour, hydrocarbons, solvent residues, oil back-streaming, vacuum grease, virtual leaks, outgassing, pump performance issues and chamber contaminants.
What peaks indicate an air leak in RGA?
An air leak is typically indicated by peaks at m/e 28 and m/e 32 in a ratio of approximately 4.5:1. Peaks at m/e 14 and m/e 16 can help confirm the interpretation.
How is water identified in residual gas analysis?
Water vapour is typically identified by a peak at m/e 18 and confirmed by a related peak at m/e 17.
What is a cracking pattern in mass spectrometry?
A cracking pattern is the set of fragment ion peaks produced when a molecule breaks apart during electron impact ionisation. These patterns help identify species and differentiate gases with overlapping nominal masses.
Why are CO and N2 difficult to distinguish by mass alone?
Carbon monoxide and nitrogen are isobaric at m/e 28, meaning they have the same nominal mass. Their cracking patterns can be used to help distinguish them.
What is the difference between a Faraday cup and an electron multiplier?
A Faraday cup is robust, accurate and lower cost, but has a higher detection limit. An electron multiplier provides greater sensitivity and faster low-level measurement, but is more expensive, expendable and application dependent.